New Canaan Real Estate Agent Productivity 2010

[image title=”average-dollar-per-agent-new” size=”large” id=”877″ align=”none” linkto=”viewer” ]

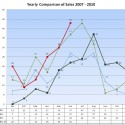
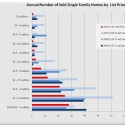
We know every real estate office touts their productivity numbers with a variety of claims and from a variety of sources….so I decided to do a little simple digging. I charted out the actual results as provided by the New Canaan Multiple Listing Service regarding number of listing/sales by office and the average dollar volume per agent.
This is raw data straight from the MLS and you do not need to adjust your screen or volume!
These numbers are not a new phenomenon for Brotherhood & Higley. Year over year we have consistently been at the top of both total number of listing/sales as well as agent dollar volume.

Market Trends for New Canaan Homes and Condominiums

[image title=”slide11″ size=”large” id=”859″ align=”none” linkto=”viewer” ][image title=”slide21″ size=”large” id=”860″ align=”none” linkto=”viewer” ]

With the recent doom and gloom headlines “US new home sales plunge to lowest levels since 1963” and “existing single-family home sales — accounting for the bulk of transactions — were at the lowest since May 1995” the question I am constantly hearing is “How is the market“?. In reality real estate is local and the reported figures reflect the national trend with the numbers being dragged down by markets in the West and South and in areas such as Las Vegas and Albuquerque. The home buyer credit was not a determining factor in our market so it’s expiration should not affect up coming sales.

Contrary to what you are reading the real estate market has rebounded quite nicely in New Canaan and Fairfield County. Our supply of available housing has dropped and sales for the first half of the year have been brisk under $3 million. Even more encouraging is the increase of high end sale (homes over the $3 million dollars). Sellers with realistic listing prices have lasted fewer days on the open market and some homes have even gone to multiple bids. Look for a slow down in home purchases during the month of August which is traditionally a slow period for home buyers. After such a bustling spring the fall activity will be interesting to watch.

Click on the charts above to see an accurate picture of the New Canaan market for the year to date.

New Canaan Real Estate Acitivity 2010


If you have a blog I suppose you should be blogging!  Well, the past several months got away from me which should indicate to you all that real estate in New Canaan became quite active.

As is the norm our inventory tends to rise during the spring. Properties look their best, people come out of hibernation and buyers want to be settled in their new homes before the weather changes. In the first six months 148 houses and 41 condominiums were new to the market creating an available inventory of  242 single family homes and 69 condos.

By the end of June, 87 homes had sold and there are 52 pending. Currently there are 20 sold condominiums and 10 pending . That’s the real story. Sales. Some buyers are shaking off their hesitation and taking advantage of low interest rates and numerous choices. Click on the chart above to see the yearly sale comparison. 2010 is showing a marked increase over the past two years. And, as evident from the second chart, sale prices continue to be stronger in the $2 million and below range. However, there has been a noticeable increase in the over $2 million and $3 million range. Will have the mid year analysis up in a couple of weeks.

New Canaan Real Estate Prices and Sales

[image title=”bh-market-stats-table-1910″ size=”large” id=”790″ align=”none” alt=”Recent market statistics as of April 9, 2010″ linkto=”viewer” ]
Pending Sales, which are not included in this chart, continued to rise during the month of March which is traditionally one of the busiest for real estate transactions. Currently there are 29 single family residences and 5 condominiums under contract. Prices are up slightly, but on average still below October 2009 prices.
The month of April should post similar numbers as the spring market is in full swing. It will be interesting to see what it looks like after the tax credit expires although in our market that has not been a primary factor. Interest rates seem to be the driving force and with the end of the Fed’s MBS purchase program this will pressure the Bond prices lower and home loan rates higher. While it is encouraging to see selling prices up home owners should be cautious in interpreting the data. The key to selling in this market is sharp pricing.

Recent Sales Summary for New Canaan

[image title=”market-stats-for-blog-07-10-jan-feb” size=”large” id=”743″ align=”none” linkto=”viewer” ]

Housing sales continue to pick up in 2010. Even though there were only 4 closed sales this month behind the scenes there is a lot of activity . Currently there are 33 residences with signed contracts, a healthy increase from last year. Buyers are starting to reach into the higher price range with 7 of the 33 homes selling between $2 and $3 million and 4 houses selling in the $3 million range.

Monthly Real Estate Sales Comparison for New Canaan Jan. ’07- Jan. ’10

[image title=”yearly-comparison-of-monthly-sales-in New Canaan, CT. 2007-20101″ size=”large” id=”672″ align=”left” linkto=”viewer” ]

Buyers took advantage of  the price dip in the market and the low mortgage rates to boost real estate sales in New Canaan. January sales topped the last 4 consecutive years in number of closings. As of this posting there are 20 properties with deposits and signed contracts just waiting for their upcoming closing date.

The numbers used to create this chart come from our local New Canaan MLS which is not guaranteed, but are considered very reliable.  I love numbers and we are being bombarded by them everyday in relation to the housing market in this country. Remember, real estate is very local and I find putting our own community figures together gives me a pretty accurate snapshot of the market in New Canaan.

Inventory will start to increase as sellers try to capture the “bonus” and “spring” markets. However, buyers are beginning to realize that prices have bottomed and interest rates won’t stay low for long. The next few months should be quite active if January and February are any indication.